Improving our software release process, guided by data

About two and a half years ago we introduced the ideas behind Continuous Delivery and Test in Production to our engineering team. At that moment, we were trying to move from a Feature Branch/Pull Request based approach to a Trunk-Based Development one.
Step-by-step, we presented concepts and defined agreements in order to build a common understanding on why, how, and what we were trying to do.
Two and a half years later, we are happy to say that we make multiple commits to the main branch every day, which means we release multiple versions to production on a daily basis. This shortens the feedback loop and helps us catching issues (mostly) as soon as they are introduced.
At least in theory.
After several months of hard work, we were finally satisfied with our deployment frequency. Still, we started to feel that the deployment pipelines of one of our most important repositories (of-mobile¹) were not that healthy.
However, “feeling” is not enough. Having some engineers “feeling that something is wrong” doesn’t tell us anything meaningful (at least not in a scientific sense). We needed to find a way to measure our health and to define what “healthy” actually meant for our deployment process.
¹ of-mobile is our mobile app’s monorepo and hosts the codebase that serves around ten million users every month. Making it delightful, we bring joy to millions of football fans. Breaking it, we upset millions of people and hurt our company’s main source of revenue.
If you can’t measure it, you can’t manage it
We cannot tell if we are making progress unless we can understand and evaluate the results of our choices and actions. We cannot tell whether our team’s performance improved or not unless we define a clear set of parameters to measure it.
However, measuring performance in the domain of software is hard.
Unlike manufacturing, we can’t really touch the results of our work. Instead of focusing on outputs (e.g. lines of code), in software development, we should focus on outcomes (e.g. how valuable those lines of code are to our users).
In addition, just like in football, it doesn’t really matter if our striker scores more goals than anyone else in the league; what truly matters is whether we win the championship or not. As a team activity, in software development we should focus on team metrics rather than on individual ones.
Fortunately, since 2013 our industry has proven ways to measure if an idea or a decision move us closer to our desired results, taking these two focuses into consideration.
Through stability and throughput, we are able to measure how our company is performing, not only in comparison to others, but, more importantly, compared to our previous selves.
These two groups of metrics are important, not because they are perfect, but because they are the best we currently understand. Although we cannot prove that they have a causal relationship with performance, they do demonstrate a statistical correlation.
We can use this model of stability and throughput to measure the effect of any change. We can see the impact of changes in organisation, process, culture, and technology. “If I adopt this new language, does it increase my throughput or stability?” — Modern Software Engineering: Doing What Works to Build Better Software Faster by Dave Farley
Applying this mental model to our context, we are able to ask ourselves: if we keep working the way we currently are, will we increase our throughput and improve the stability of our pipelines? In other words, will we improve our software deployment process and, as a result, increase the value we deliver to our users?
With clear metrics in place, we were ready to move from being victims of guesswork (or, in this case, “feeling”) to being more like engineers.
Measuring of-mobile’s four key metrics
In the State of DevOps reports (and in the book that resulted from it: Accelerate: The Science of Lean Software & DevOps), Dr. Nicole Forsgren and her team came up with the following four key metrics:
- Delivery Lead Time
- Deployment Frequency
- Mean Time to Restore
- Change Fail Rate
The first two metrics measure throughput, while the latter two measure stability.
In addition to bring a statistical correlation between these metrics and performance, their research also demonstrated that there is no tradeoff between improving performance and achieving higher levels of stability and quality.
The four metrics are meaningful only when analysed together.
In order to make sense of these metrics in our very specific context (the of-mobile pipelines’ health), we first agreed on the following definitions:
- Lead Time (throughput): how long it takes a change to go from committed to deployed. In our context, it represents how long each pipeline takes from being triggered until it is successfully completed
- Deployment Frequency (throughput): how frequently changes are pushed to production. Since each commit to the main branch triggers a pipeline execution, we consider “deployment frequency” as “the number of commits in a given period of time”
- Mean Time to Restore (stability): how long it takes to recover from a failed deployment (i.e. once our pipeline gets red, how long does it take to be back to green?)
- Change Failure Rate (stability): how frequently a deployment introduces a failure that requires immediate intervention (i.e. how frequently our pipeline fails)
Thus, backed by science, it was time to collect and learn from them.
Data gathering
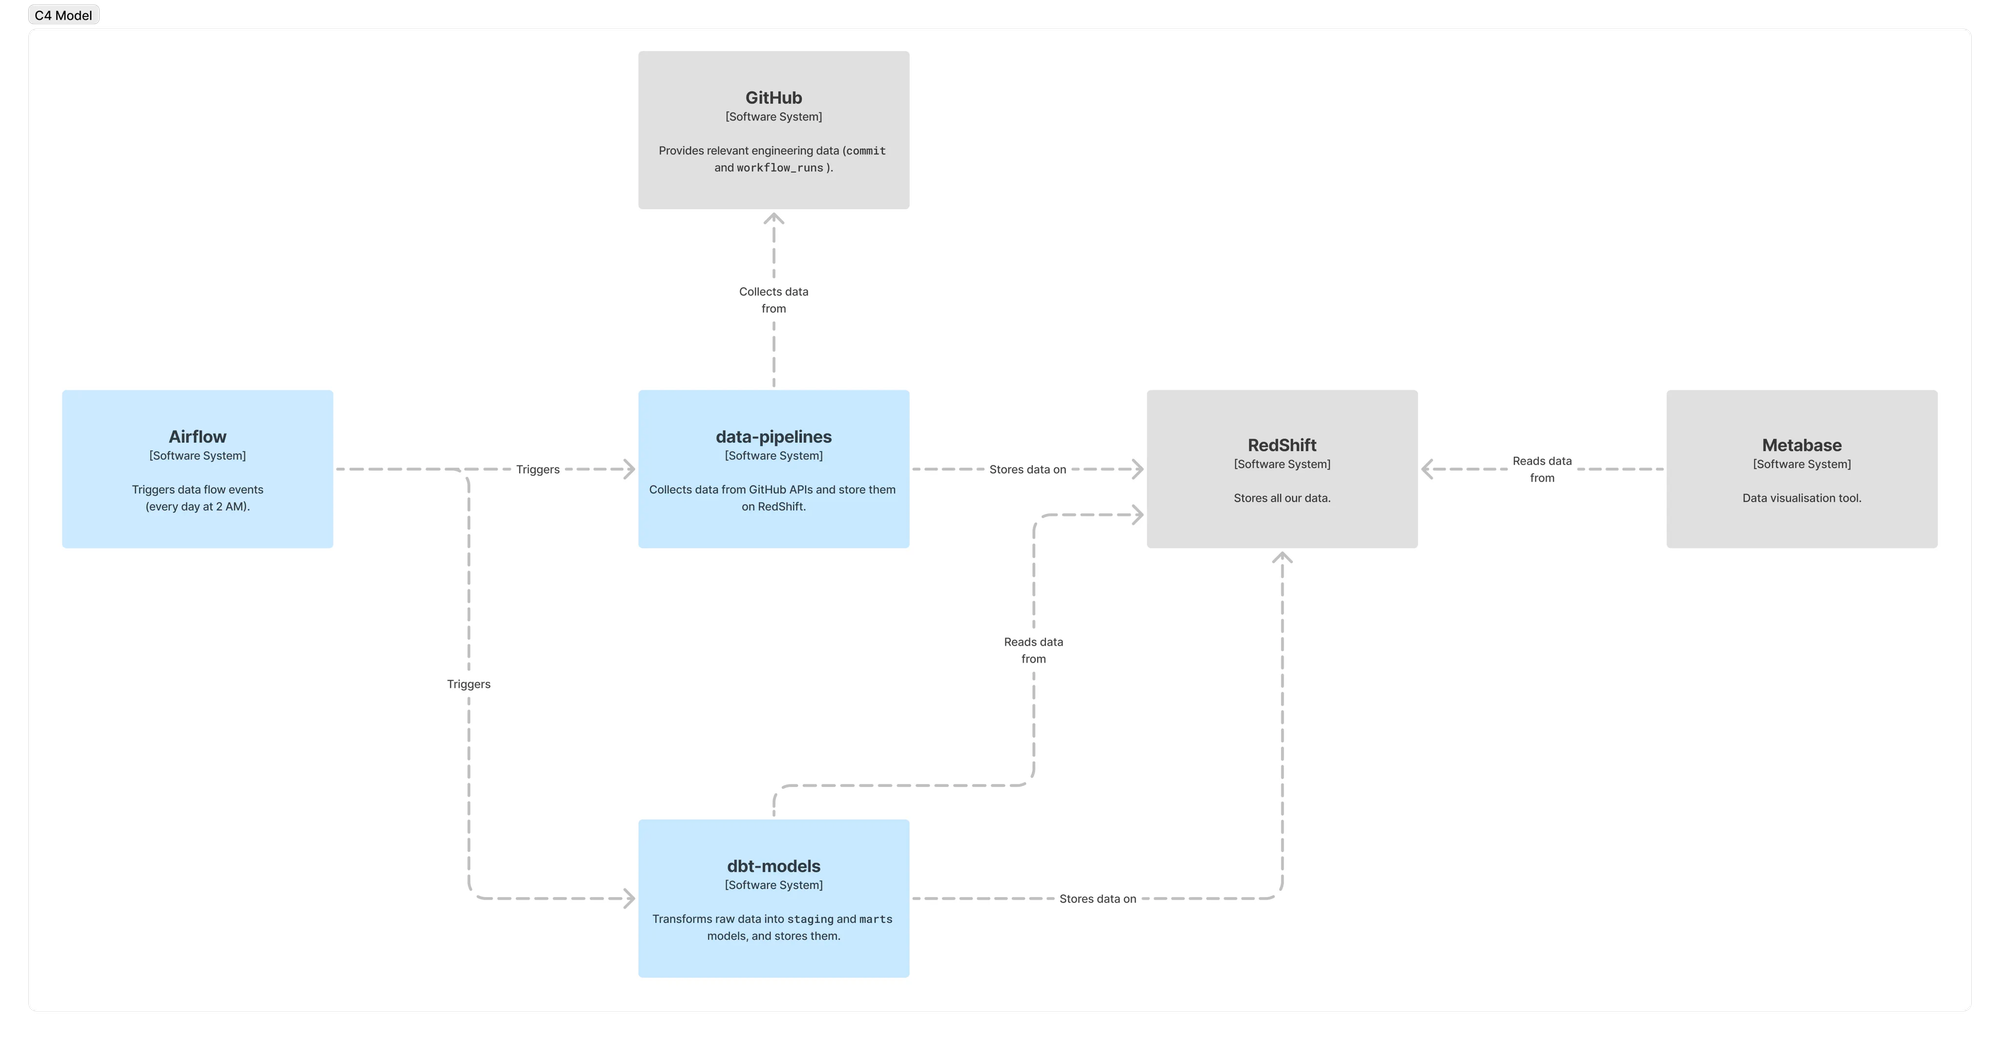
In order to get the four key metrics, we relied on GitHub APIs. We used the workflow runs API to measure Change Failure Rate, Time to Restore, and Lead Time. While for measuring Deployment Frequency, we used the commits API.
Code wise, to collect these data from GitHub and add them to our data warehouse, we developed a new component on our Data Pipelines repo, set up a few dbt models to transform and store them, and added two new triggers to our Airflow instance (one for getting the data and another one to transform them).
In summary, we ended up with the following architecture:
Once our data pipeline was ready, we were able to show the results in a Metabase dashboard:
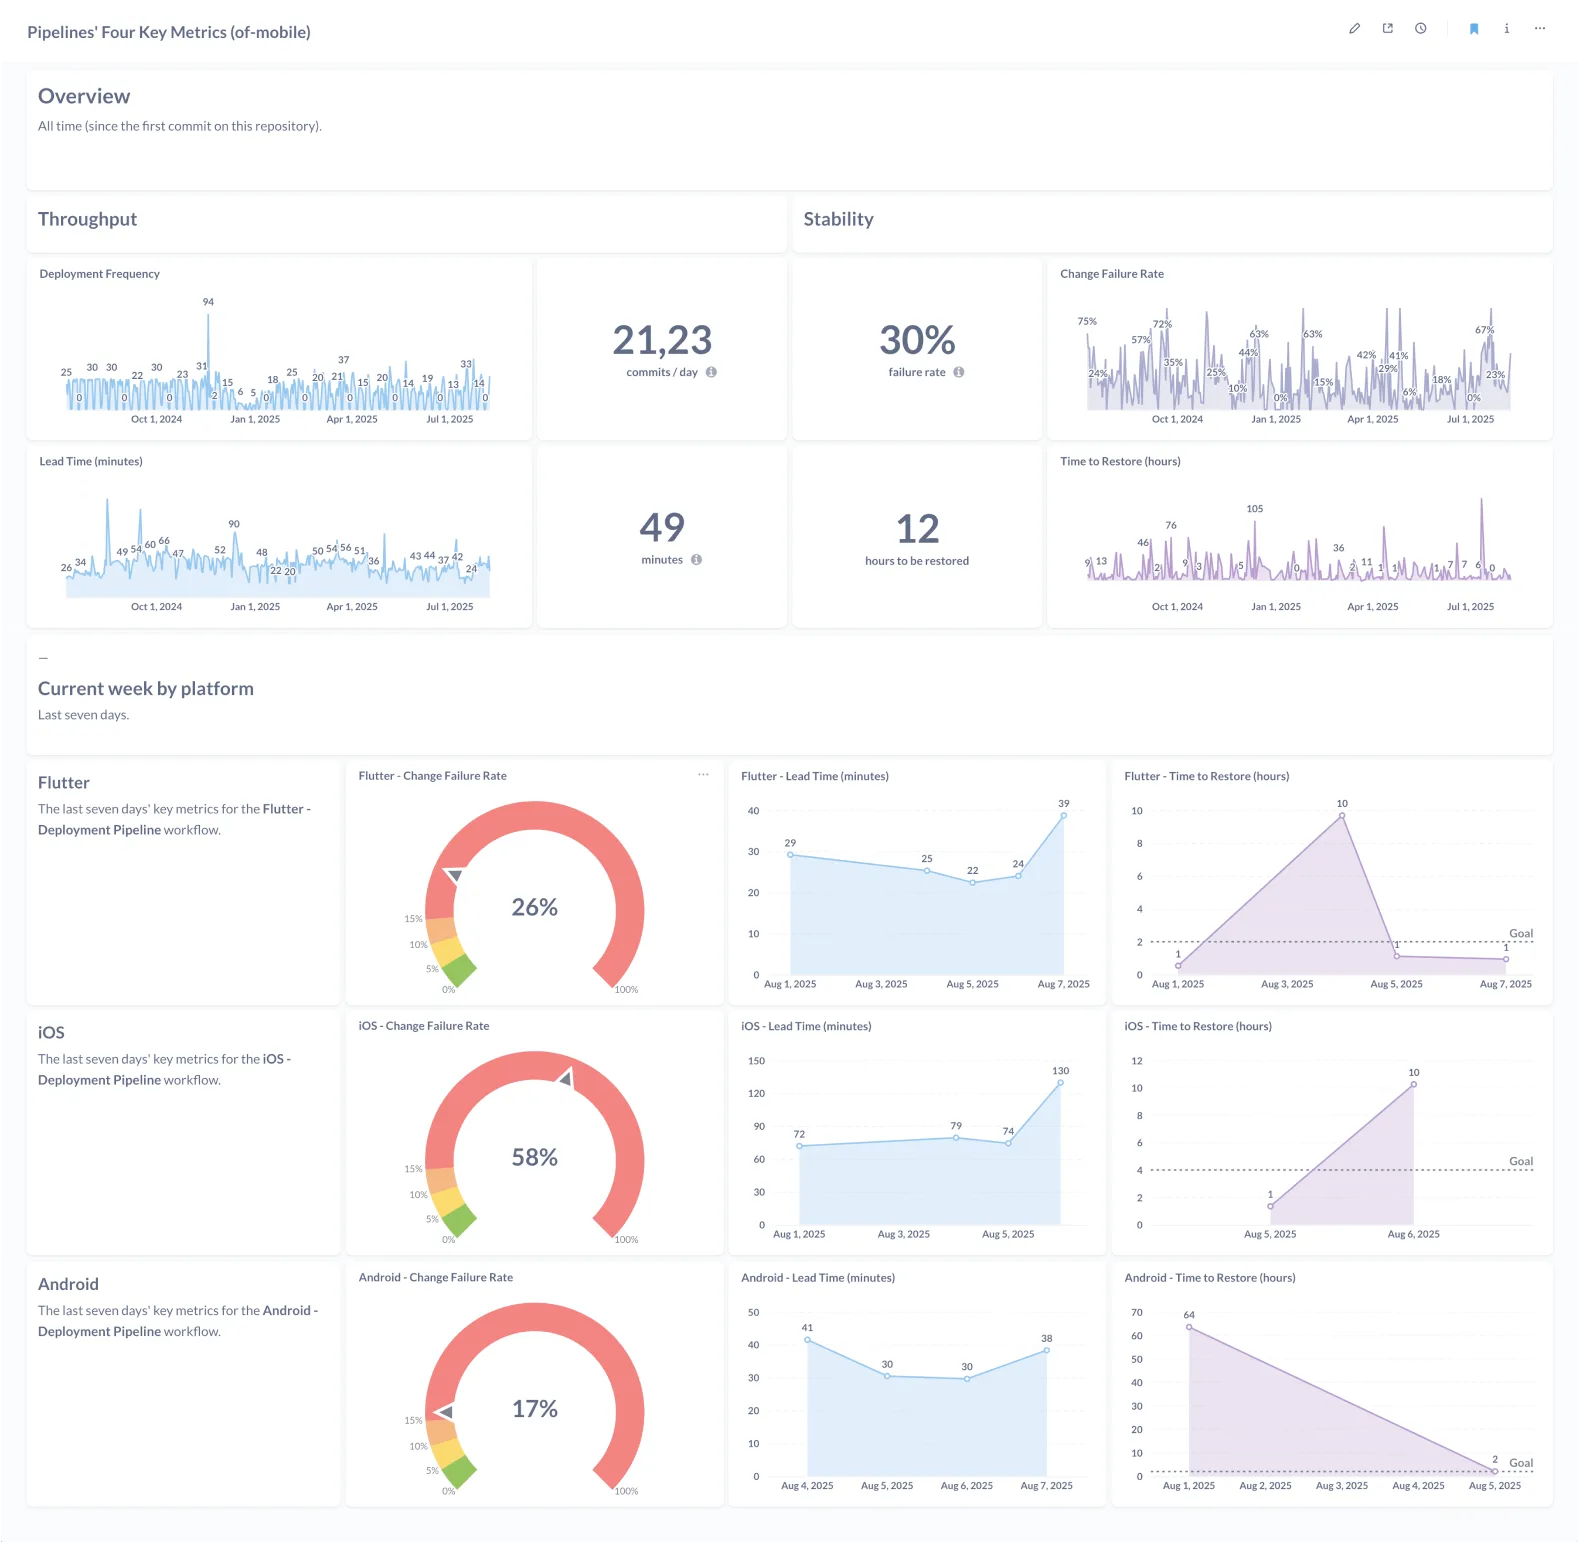
As we could see, our throughput metrics were, indeed, really good. Based on last year’s State of DevOps report, we could be classified as an Elite Performer. Well done, team!
However, our stability metrics were not ideal. Around 1/3 of our commits resulted in a broken pipeline and, on average, we used to take around one and a half business days to fix it.
As we were initially feeling, stability wise, we had a lot of room for improvement.
Although we find ourselves in a much better position to deliver faster and with more quality² (compared to the feature branch approach we had two years ago), we still had a lot of work to do.
It’s important to note that these broken pipelines occurred for a variety of reasons. They might have happened due to development mistakes (e.g. failing tests), infrastructure issues, or third-party factors such as the App Store or Google Play rejecting a test build.
Although we still need to dive deeper into each failure in order to fully understand and properly address them, the reality is: there is no continuous delivery with broken pipelines. There are no releases. And, if we are not releasing the code we are writing, it would be much better not to write it at all.
The feeling was confirmed. We needed to take action.
² One year after starting this cultural change, the number of “hotfix” releases dropped by 40% on Android and by 65% on iOS. This means fewer bugs reached our users and more time was dedicated to develop new features.
Defining a starting point, guided by data
We began the shift towards a continuous delivery/trunk-based development approach by working on agreements and establishing best practices that should be followed by every team member in order to reach our desired outcome: build better software, faster.
However, as the data showed us, we were falling short of fulfilling our agreements.
For instance, although we had a “never go home on a broken build” and a “20 minutes time-box to revert a broken change” agreements, data revealed that we were taking one and a half business days to fix a broken pipeline.
From that moment, guided by data, we knew where we should start: fix a team misalignment.
Governance and compliance
Hope is not a strategy — Site Reliability Engineering
This is an extremely recurring situation in our industry. At some point, nearly everyone working with software development has experienced (or will experience) discussions that end with a “oh, there was a communication problem”, followed by a “next time, let’s align earlier to prevent this to happen again”. However, “next time” comes and we repeat the same mistake.
It feels like there is always some sort of misalignment in the air.
But, is there anyway to solve it?
The solution could be based on implementing governance (or compliance), done through fitness functions.
Fitness function, in architecture, is a test. It’s something we write (or metrics we gather) that tests some sort of architectural characteristic, objectively (through metrics). — The Intersection of Architecture and Implementation
In our context, the Pipelines’ Four Key Metrics dashboard could serve as our “fitness function”, guiding our efforts toward the outcomes predicted by the Accelerate model. By tracking our scores in terms of stability and throughput, we are able to ensure that the changes we make are, in fact, beneficial and that we are moving in the right direction.
However, the only thing governance shows us is that we have a problem. This is not enough. Once we highlight the issues we have, we need to move forward and tackle the root cause of misalignment: problems with communication and/or collaboration.
Communication and collaboration
Most of what we had done so far was about communication (rather than collaboration). Communication is about letting everyone know what was done (or should/will be done). Collaboration is about communicating AND getting people involved in the decision.
If developers don’t know why a decision was made, they are less likely to agree with it. If developers are not involved in the decision, they will be less likely to follow it. — The Intersection of Architecture and Implementation
Communication is not enough.
However, building and maintaining a collaborative environment can be challenging. Collaboration is a two-way street.
For instance, ADRs sometimes remain open without engagement, and Slack threads may go unanswered. This doesn’t happen due to negligence, but mostly due to competing priorities. Even with the best intentions, newly agreed rules can be hard to consistently follow.
Building a Generative (Performance-Oriented) culture requires high cooperation and these challenges highlight just how much effort is required to build and sustain trust, and how easily our collective momentum can be affected.
In the end, the most important feature of any system is its reliability. Meeting reliability goals requires well-engineered software, operations, and business. Building a reliable deployment pipeline is a collaborative job and it’s all about individuals and their interactions.
Once we realised the need for fitness functions to implement our governance and understood that the only sustainable approach was to develop them collaboratively, we could start gathering references on how to proceed.
Standing on the shoulder of giants
Thankfully, there is a field of study that perfectly fits our requirements: Site Reliability Engineering.
Site Reliability Engineering (SRE) applies software engineering to IT operations to enhance reliability and scalability through automation, monitoring, and incident management. In order to be effective, it requires the collaboration between software engineering, business, operations, and product teams.
Among the many concepts within SRE, we focused on the following three and adapted them to our context:
- Service Level Indicators (SLIs) → Metrics that describe users experiences
- Service Level Objectives (SLOs) → Targets for the overall health of a service (or system)
- Error Budget → A rate at which the SLOs can be missed
SLIs are the metrics we need to have in place in order to measure our performance. Since we were backed by the State of DevOps research, our SLIs were essentially the four key metrics it provides: delivery lead time, deployment frequency, mean time to restore, and change failure rate. There was no need to reinvent the wheel.
SLOs are the targets we aim to achieve. They are internal goals for measurement of a service’s health. In our context, SLO are the definition of “healthy” that we were looking for. For the deployment pipelines, we decided to use the Elite Performer metrics, from the State of DevOps report, as a baseline and tailored them to fit our needs.
In the 2024’s report, the numbers were:
- Delivery lead time: less than one day
- Deployment frequency: on demand (multiple deploys per day)
- Mean time to restore: less than one hour
- Change failure rate: 5%
It’s important to notice that there should always be some flexibility in our objectives.
Striving for an ‘always green pipeline’ should not be the ultimate goal. 100% is the wrong reliability target for basically everything and the error budget concept comes from this observation.
There is a structural conflict between pace of innovation and product stability. After all, things will break. The only way to avoid breaking them is to avoid changing them.
The real question is: how much “breakability” is acceptable, from the user’s perspective, for a specific context? This “how much” value is our error budget.
There are two key rules of thumb regarding error budget:
- When budget is exhausted, prioritise reliability (stability)
- When budget is available, prioritise velocity (throughput)
Using the previous numbers as an example, if the change failure rate is around 2%, we have room to try riskier experiments that might break the pipeline. On the other hand, if this rate increases to around 30%, we should pause pushing new commits until the pipeline is stabilised and back to green.
The error budget is meant to be spent. It never accumulates. If we have it, let’s burn it.
Next Steps
Building software based on the scientific method is what brings us closer to real engineering.
Having a clear method not only moves us away from guesswork but also addresses one of the most challenging aspects of our industry: alignment. Since any “experiment” can be checked and reproduced through the scientific method, any team member is able to question any decision we make.
Learning from the best references should always be our first goal. Fine-tuning their solution to our context is the next step, followed by gaining full confidence in the topic.
Confidence is what will rev our culture engine. But it takes time.
It’s too early to measure the impact of this initiative. The whole process is still ongoing. However, being guided by data and strong references significantly increases our chances of success.
With clear indicators and goals in place, we are able to track our progress, continuously learn from it, and determine after a few months whether we’ve reached them or not.
We want to be in the Elite Performers group and to take the many benefits that come with it.
Resources
Books
- Accelerate
- Continuous Delivery Pipelines
- Continuous Delivery: Reliable Software Releases through Build, Test, and Deployment Automation
- Modern Software Engineering: Doing What Works to Build Better Software Faster
- Google SRE — Site reliability engineering book Google index
- Observability Engineering
Videos
- Jennifer Petoff — Building High-Performance Software and Teams with Site Reliability Engineering
- Swim Don’t Sink: Why Training Matters to a Site Reliability Engineering Practice • Jennifer Petoff
- The Intersection of Architecture and Implementation — Mark Richards — DDD Europe
Reports
Blog Posts